The core product of Nordsense is the NS Platform, a platform that bridges the sensor to a visual user interface for operative purposes. The NS Platform allow users to monitor in real time which waste bins need to be emptied. The user can generate on-demand routes that are optimized towards the containers which need to be emptied. Everything happens dynamically and it is event driven, so even while trucks are in route and in the meantime a container suddenly becomes full, it can be added to the nearest vehicle, if the space allows that. The platform will also provide some useful analytics data, such as trip duration and cost estimation.
CAPABILITIES
Interface Design, User Experience, Visual Design
TOOLS
Sketch, Figma
Updating the Look
In 2017 I started to work at Nordsense. My first task was to give an update on the overall interface of our web platform. The company did not have anyone in charge of design-related tasks and the current interface was built on a Angular Material theme. Nothing wrong on using templates, as they are a fast way to get started and really handy when there is no designer around. However, the current interface was not being in line with the company’s brand identity: colors, fonts, and the overall look and feel were just not right.
By that time we did not have any real customer yet, only some pilot cities trying out the solution. User research was difficult to be done beforehand, the bureaucracy to get in touch with the right people in municipalities or even defining user roles was quite a challenge. I had the CTO of Nordsense helping me to take decisions, he had a lot of knowledge on the waste management industry and was in direct contact with customers, knowing their pains and what would bring value to them.
Old interface — Screenshots of the platform UI by the time I joined Nordsense. A lot of room for improvement
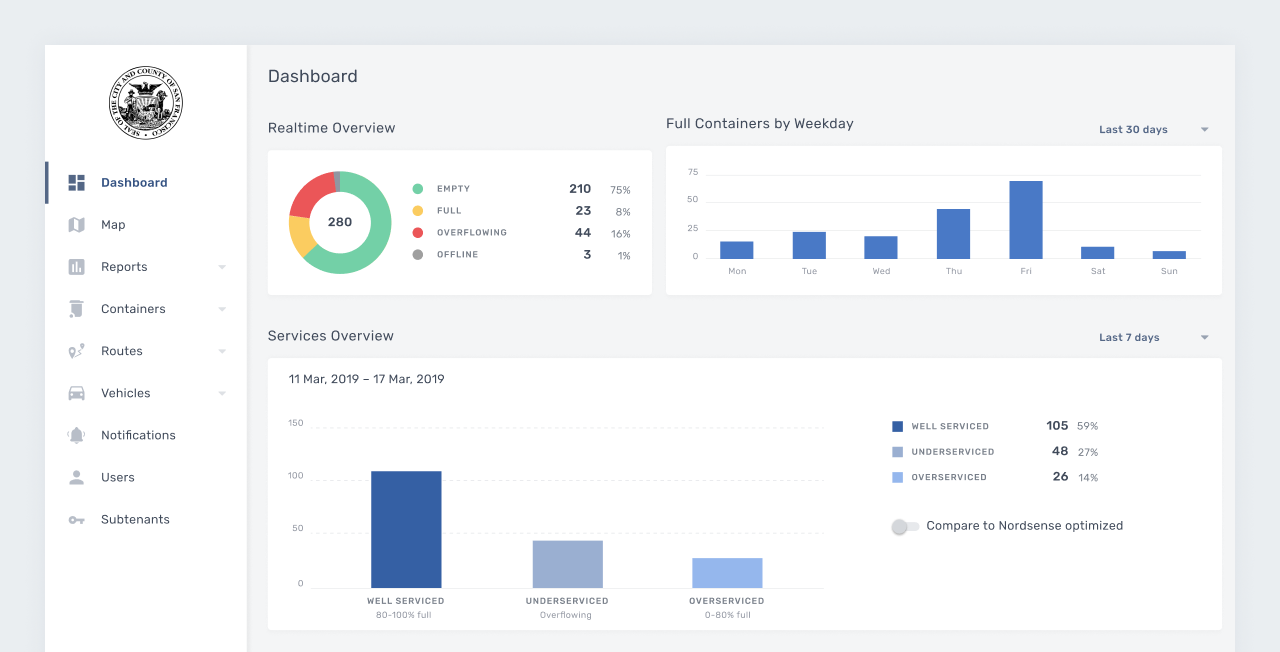
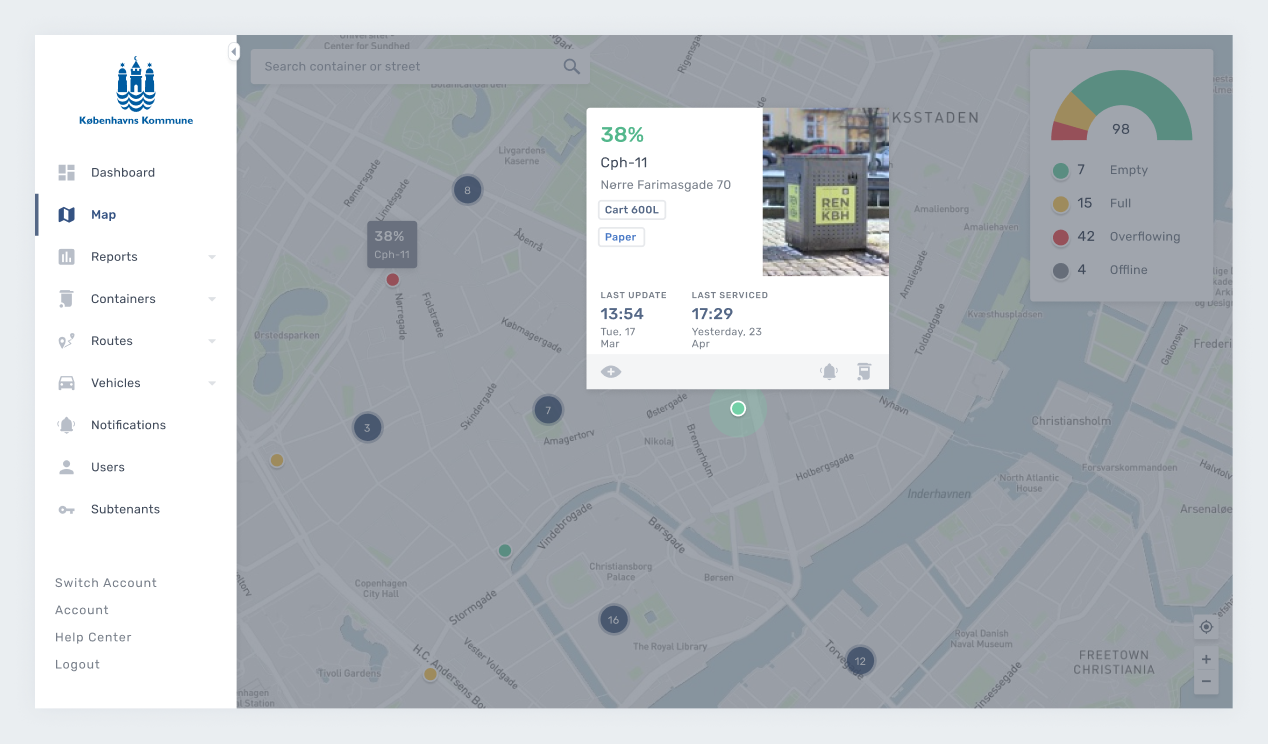
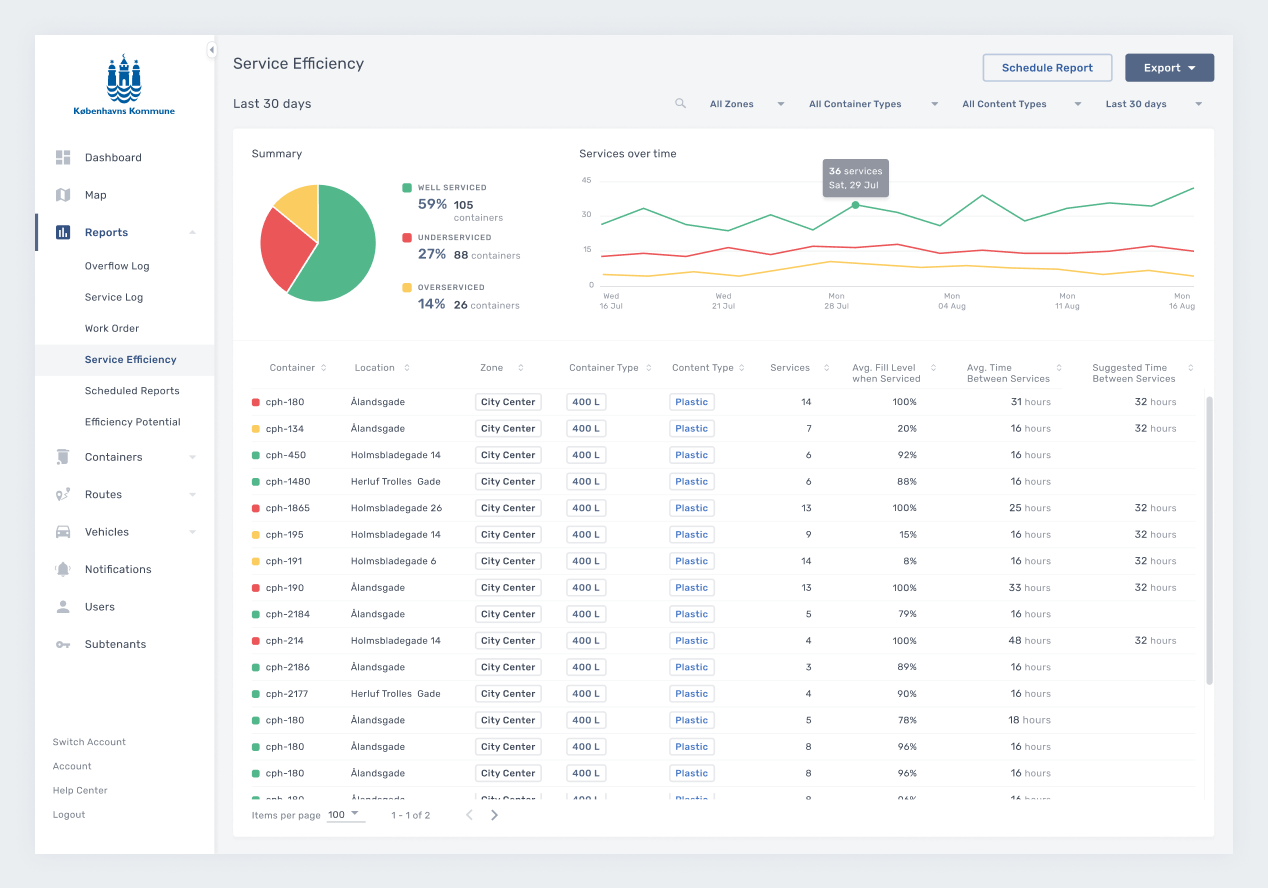
Revamped Interface
These changes were not done from one day to another. We wanted to let our users comfortable with the transition, so the design and implementation of the interfaces were done in steps, making users more likely to accept and get familiar with the changes.
Map screen when a container is selected. An overlay covers the map to focus the attention only on the selected item. Container list. Each container has service log and activity data to be displayed.The user can go deeper into the data by opening the details screen. Service efficiency report screen. Reports can be scheduled to be received by email.
Style Guide
Creating a style guide became necessary due to the size of the platform. While designing the interface, several components were being reused in other parts of the system. A shared library was created in Sketch (and later moved to Figma) containing all the components, colors, typography, icons, and color palettes.